HOW DIFFERENT GENERATIONS ARE ENGAGING WITH THE HOUSING MARKET
Even with today’s high home prices and high mortgage rates, many people are still willing to move — largely because of major life events such as marriages, births, retirements, and so on. These reasons for moving fall into the category Ali Wolf, Zonda’s Chief Economist, called “life happens” in the October Market Intelligence webinar.
That’s why people are moving. But who is moving? What are the demographics of today’s homebuyers?
THE MOST ACTIVE HOME BUYERS
The most active buyers right now are those looking to move up, followed by those buying an entry-level home, with relocation in third place.
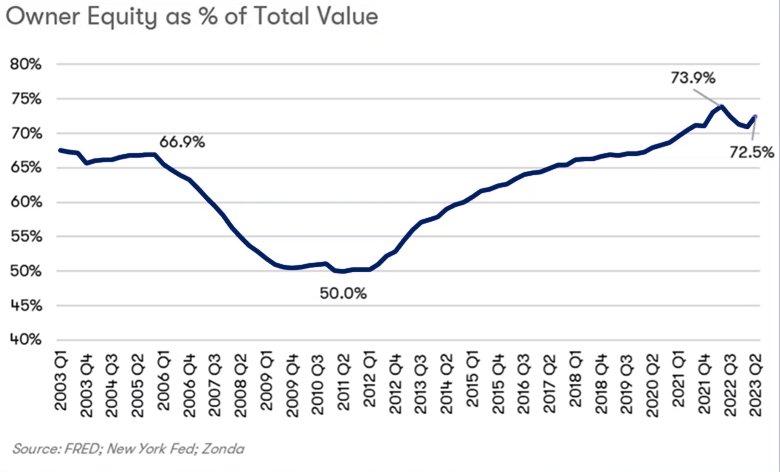
Move-up buyers are the most active type, despite the fact that 80% of homeowners who have a mortgage have a rate under 5%; 60% have a rate under 4%. Why are they willing to buy a new house and lose their low mortgage rate? Wolf says one answer is easy: equity. Homeowners have benefited from rising prices. Although owner equity as a percentage of total home value is slightly down from its peak a couple of years ago, it’s still very high, and well above what it was in the mid-2000s.
EQUITY GAINS
Equity is a smaller factor if someone is moving in the same submarket because the values of all houses have gone up along with their own. Equity is more of a benefit if homeowners are moving to a slightly different part of town, a different city, or out of state.
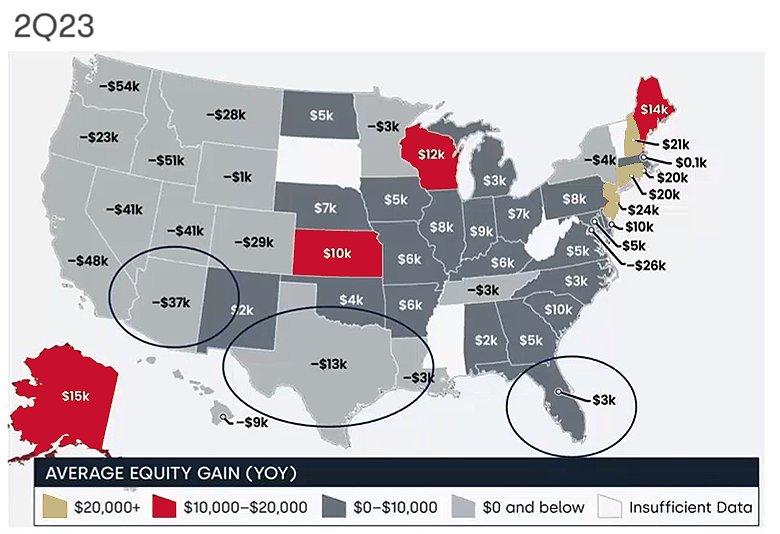
If you looked only at the first map below, you’d get a skewed impression of equity gains. It shows, by state, average gain in equity in the second quarter of 2023 over the second quarter of 2022. Many states are showing negative equity.
However, this map shows the average equity gain in the second quarter of 2022 over the second quarter of 2021. There are some very large average gains.
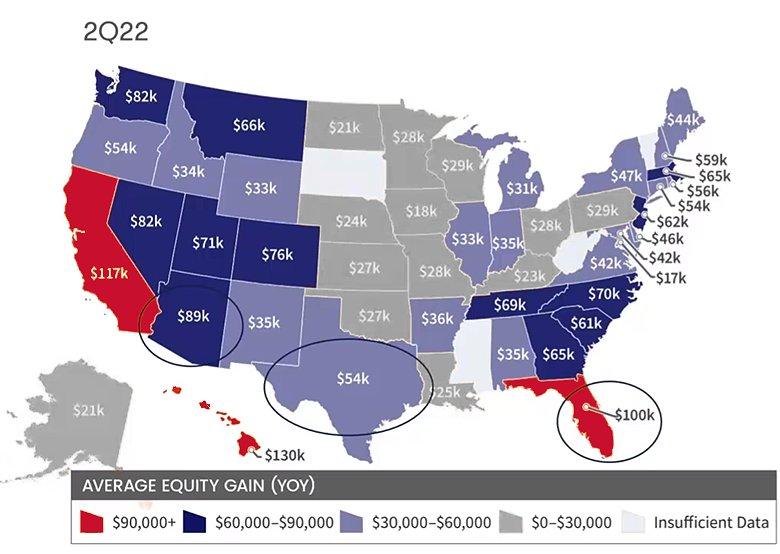
Wolf suggests it’s perhaps more valuable to look at the cumulative gain in equity, especially given the line graph above that shows largely consistent equity growth since 2011. This means that over the two years from second quarter of 2021 to the second quarter or 2023, there was an average equity gain of $41,000 in Texas, $52,000 in Arizona, and $103,000 in Florida. And that’s just in two years. Of course, people who bought homes a decade or two ago, have seen even bigger increases in their equity.
BOOMERS’ HOME OWNERSHIP AND HOME BUYING
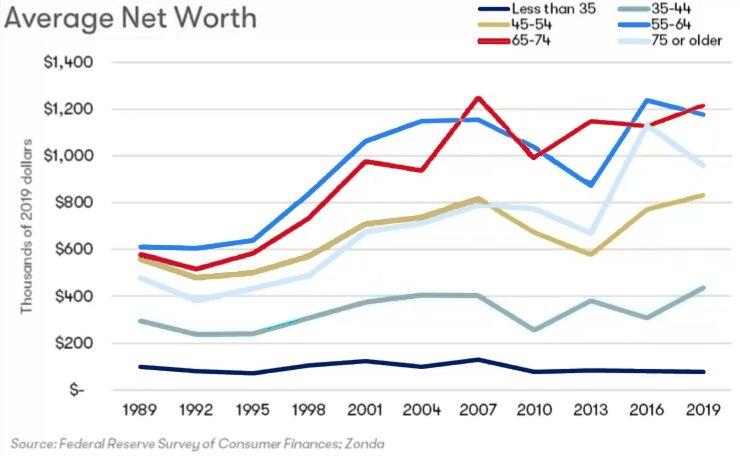
Generally speaking, the older someone is, the more likely they are to own a home. Boomers have the highest rate of home ownership and control the largest share of the nation’s wealth - about 50% of it - despite being about 24% of the population. (Note that Wolf refers to the 55+ age group as boomers.)
Before the pandemic, the majority of boomers in most markets hadn’t moved in over 20 years. Since the pandemic, they’ve become much more mobile. In 2022, the 55+ age group accounted for more than 55% of all inbound United Van Lines moves. A survey by United Van Lines indicates that the top three reasons for moving are:
- Wanting to be closer to family (35%)
- A new job or company transfer (33%)
- Retirement (20%)
Wolf notes that, post-COVID, wanting to be closer to family continues to be a primary driver, but a new job or transfer is decreasing as a driver. Every boomer will be of retirement age by 2030, so the influence of retirement can be expected to grow.
In 2021, boomers made 29% of all home purchases. In 2022, that percentage was up to 39%, the largest share of buyers. They were also the largest share of sellers, at 52%.
Millennials were the most active group of homebuyers between 2014 and 2021. But in 2022 boomers overtook them for the first time since 2014 as the most active buyers and most active sellers.
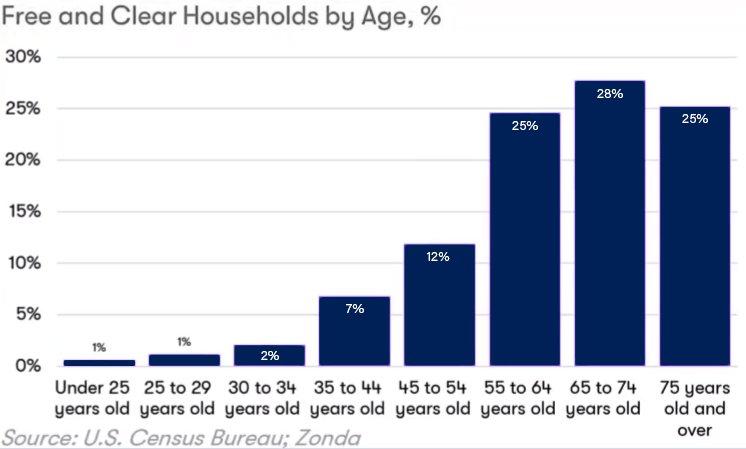
Wolf mentions a number of reasons for boomers taking the number one spot, including equity, lifetime savings, and a change in lifestyle (such as retirement). But she also says that an important factor is a lack of interest rate sensitivity. As mentioned earlier, 80% of homeowners with a mortgage have a rate under 5% — but 42% of US homeowners don’t have a mortgage at all; they own their homes free and clear and this group is concentrated in the 55+ age range.
Boomers who do have a mortgage and who are moving down (either in size or location) may not see their monthly payment go down much, if at all, because of today’s higher mortgage rates.
GEN X, MILLENNIALS, AND GEN Z
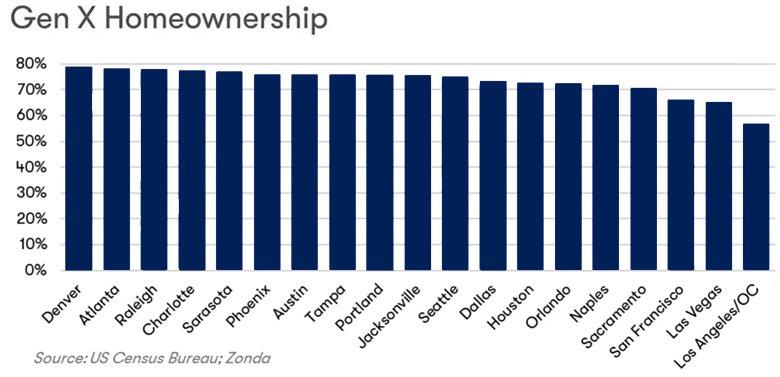
The Gen X age group has also benefited greatly from home equity increases, with a 60% to 80% ownership rate across geographical markets.
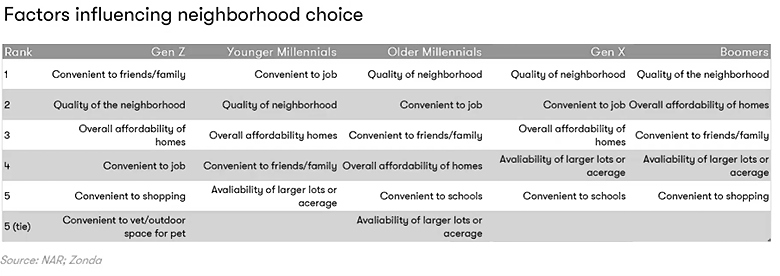
Millennials have also benefited from equity gain, with older millennials (age 35-40) having a home ownership rate of 60%+. There’s a lot of overlap across age groups in the factors that influence neighborhood choice. This is good news for builders because it means there’s less need to get highly customer-specific when appealing to potential buyers.
The increase in boomers' equity has other effects. Boomers are the second largest living generation and they’re parents to millennials, the largest living generation. Although millennials are finding affordability a challenge, their parents are boomers — who control the highest share of the nation’s wealth. According to a 2019 survey, more than 70% of boomers plan to give away some or all of their wealth while they’re still living. Their millennial children are, in some cases, using this source for their down payments.
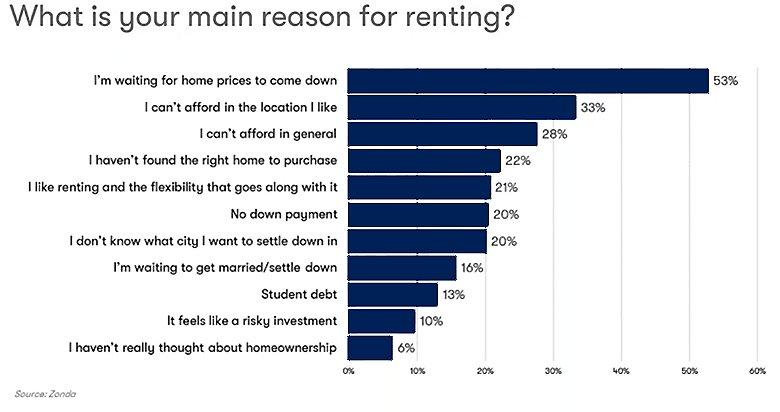
If millennials haven’t bought a home and are still renting, why is that? According to Zonda’s survey, the top three responses are about affordability, as you can see in the chart below.
Similarly for Gen Z, the obstacles to homebuying that they anticipate largely involve affordability. A large majority (86.2%) want to own a home and many of them are saving for their first home. In 2022, Gen Z represented 9% of market activity, and this share will likely grow as they get older.
According to Rocket Mortgage, 69.1% of surveyed respondents are currently saving some amount of money. Within that group, 56.4% are putting money away for their first home. Of the 86.2% of Gen Zers who want to purchase a home, nearly 45% are looking to purchase their first home in the next 5 years, as per Realtor.com.
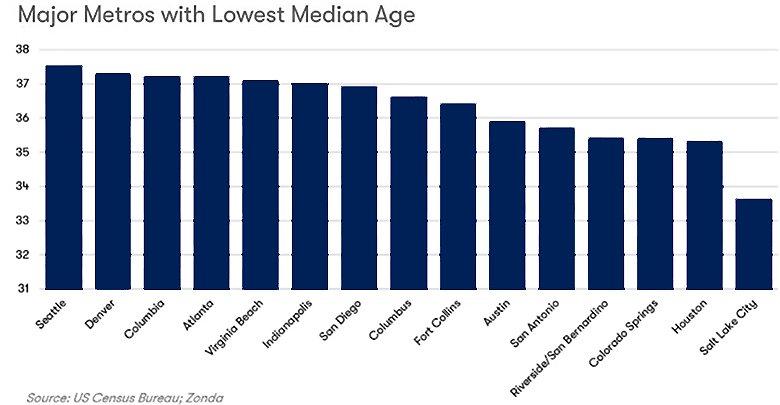
Gen Z is not as big a group as either boomers or millennials and of course some locations have a greater concentration of them than others. The chart below is based on the lowest median age in major cities across the country. Salt Lake City is the youngest, followed by Houston and Colorado Springs.
RENT VS. MONTHLY MORTGAGE PAYMENTS
One challenge in attracting this generation to home ownership is that median monthly mortgage payments are now significantly higher than median monthly rents. (This contrasts with the years from 2010 to 2022, when median monthly mortgage payments were lower than median monthly rents.)
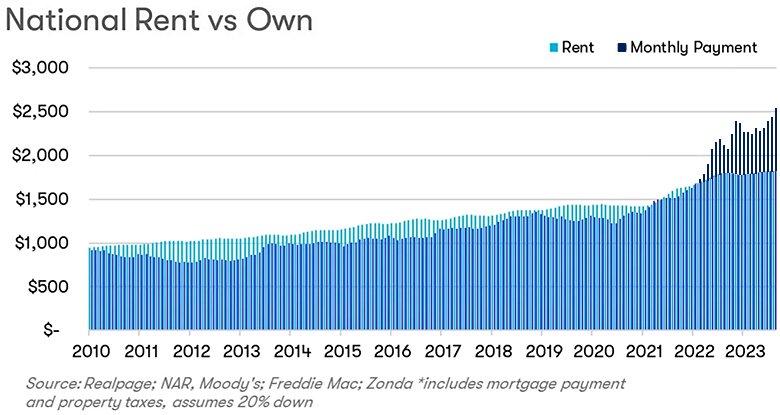
Wolf notes that focusing only on monthly expenditure is a simplistic way of looking at the market, and she’s optimistic that builders can meet this challenge through education regarding the benefits of homeownership such as building equity.